Royal Lepage Summit Realty
2611 Ellwood Dr S.W., Edmonton, Alberta
P: 780.499.5696
F: 780.431.1600
Friday, April 26, 2013 - Belmont Home Sale Prices
Belmont Home Sale Prices
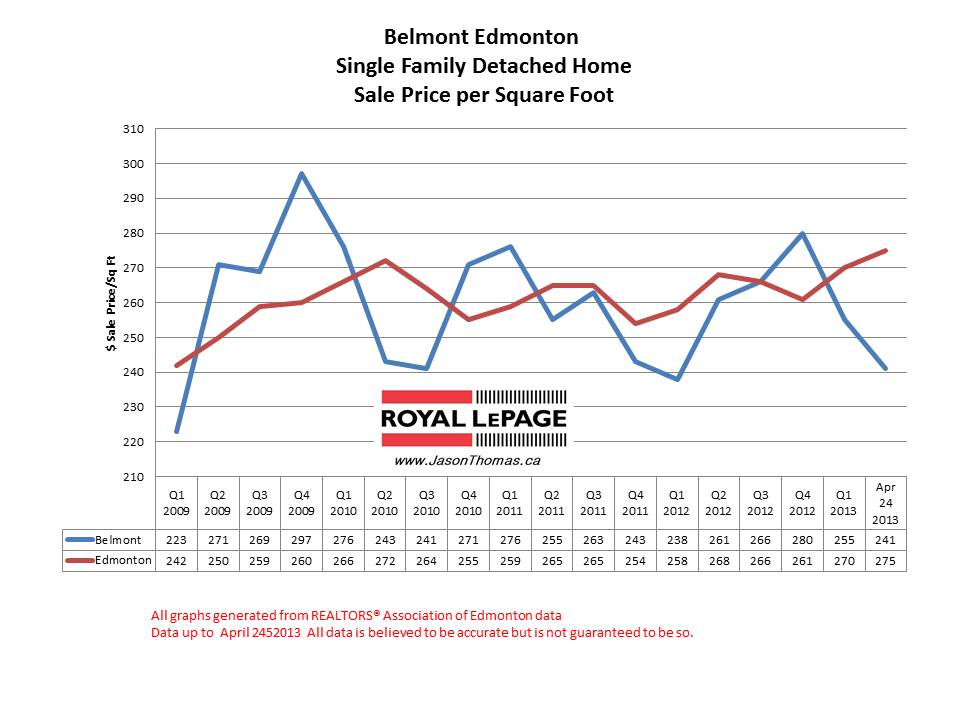
The Belmont home sale price per square foot has been softer than the Edmonton average selling price per square foot in 2013. Belmont homes did sell for more than the Edmonton average in the last half of 2012. Belmont normally does sell just above or just below the Edmonton average sold price per square foot. I expect to see the Belmont average sale price per square foot to move higher as we move further into 2013, following the pattern of 2010 when Belmont bounced back up again. The highest sale price for a home in Belmont in the last 12 months was $465000. The average time to sell a home in Belmont in 2013 has been 48 days. The Clareview average days on market in 2013 has been 45 days. The Edmonton average days on market this year is at also 45 days.

To view graphs on other Edmonton neighbourhoods visit Edmonton Selling Prices by Neighbourhood. For more information about the area visit Belmont Neighbourhood. If you are interested in a no obligation market evaluation on your home click Belmont Home selling Prices


