Royal Lepage Summit Realty
2611 Ellwood Dr S.W., Edmonton, Alberta
P: 780.499.5696
F: 780.431.1600
Friday, June 21, 2013 - Edmonton Real Estate Sold Price to List Price Ratio
Edmonton Real Estate Sold Price to List Price Ratio
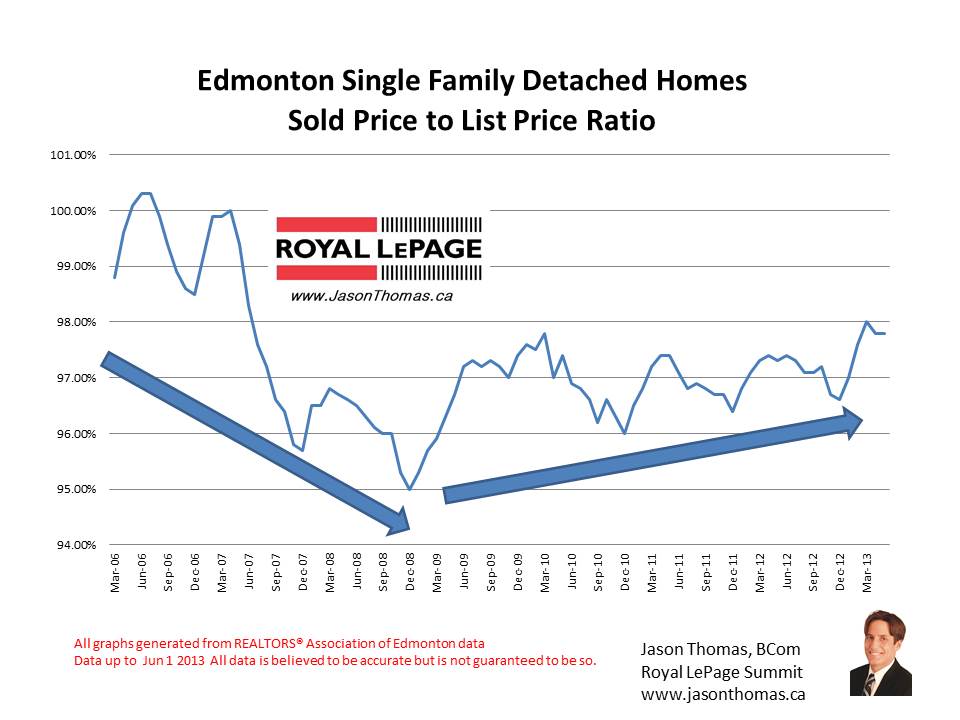
The Edmonton real estate sold price to list price ratio has been volatile looking back to 2006. In May of 2013 we are selling for 97.8% of list price for single family detached homes in Edmonton. The highest sale price ratio we have ever sold for was 100.3% back in April and May of 2006 at the height of Edmonton's real estate boom. The lowest selling price to list price ratio was during the financial crisis, in December of 2008 the ratio was at 95%.
The sale price to list price ratio is a useful measurement, it shows how much a buyer is able to negotiate off of a seller's list price. When the ratio is higher it indicates the market is stronger, and the buyer's are not in the driver's seat. Multiple offers caused the ratio to exceed 100% during the boom of 2006 and 2007. In 2013, we have been consistently selling around 98% for the last 3 months. The last time we had this strong of a market after the boom bust of 2006 to 2008 was in 2010. That year we saw the sold price to list price ratio in Edmonton reach 97.8%. The difference with 2013 and 2010 though, is how the sold price to list price ratio was not stable and fell quickly in 2010. That had a lot to do with excess listing inventory in Edmonton. Unlike today, we are sitting at a lower level of housing inventory in Edmonton and therefore the market is stronger.

To view graphs on other Edmonton neighbourhoods visit Edmonton Selling Prices by Neighbourhood. If you are interested in a no obligation market evaluation on your home or would like some professional help finding your new home click Edmonton real estate sold price to list price ratio


