Royal Lepage Summit Realty
2611 Ellwood Dr S.W., Edmonton, Alberta
P: 780.499.5696
F: 780.431.1600
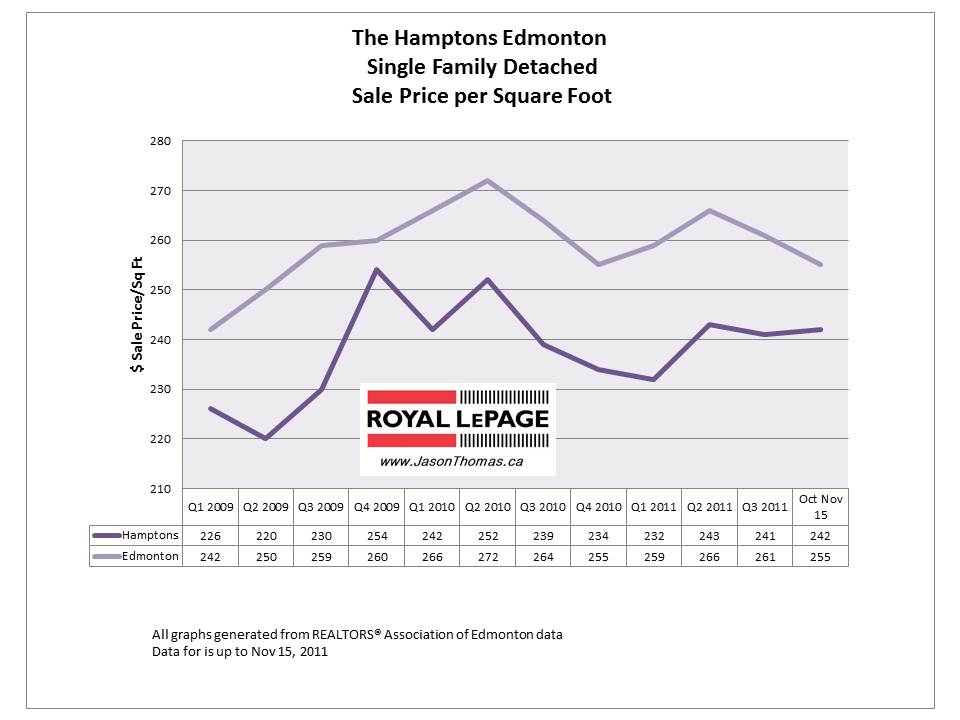
Wednesday, November 16, 2011 - The Hamptons Edmonton Real Estate Price Graph 2011
The Hamptons Edmonton Real Estate
The Hamptons Edmonton real estate average sale price per square foot has been stronger in October and November versus the Edmonton sale price per square foot average. The Hamptons has had a marginal increase from the 3rd quarter of 2011 into Ocotber and November. The Hamptons has actually been quite steady since the 2nd quarter of 2011. Edmonton on the other hand has fallen off the 2nd quarter highs on an average sold price per square foot basis. The average time to sell a home in the Hamptons in October and November has been a little higher at 89 days. That is quite a bit higher than the overall Edmonton days on market of 51 days in the same time period.

Click here if you are interested in finding out what your Hamptons home is valued at in today's real estate market.
Find more MLS® sold information, including graphs, on Hamptons real estate and other Edmonton neighbourhoods here


